


Hardcover: 207 pages
Publisher: Graphis Press; 5th expanded ed edition
Language: English
ISBN-10: 3857094109
ISBN-13: 978-3857094101
Product Dimensions: 24.5 x 24 x 2.0 cm
Release Date: 1983
Price: sold
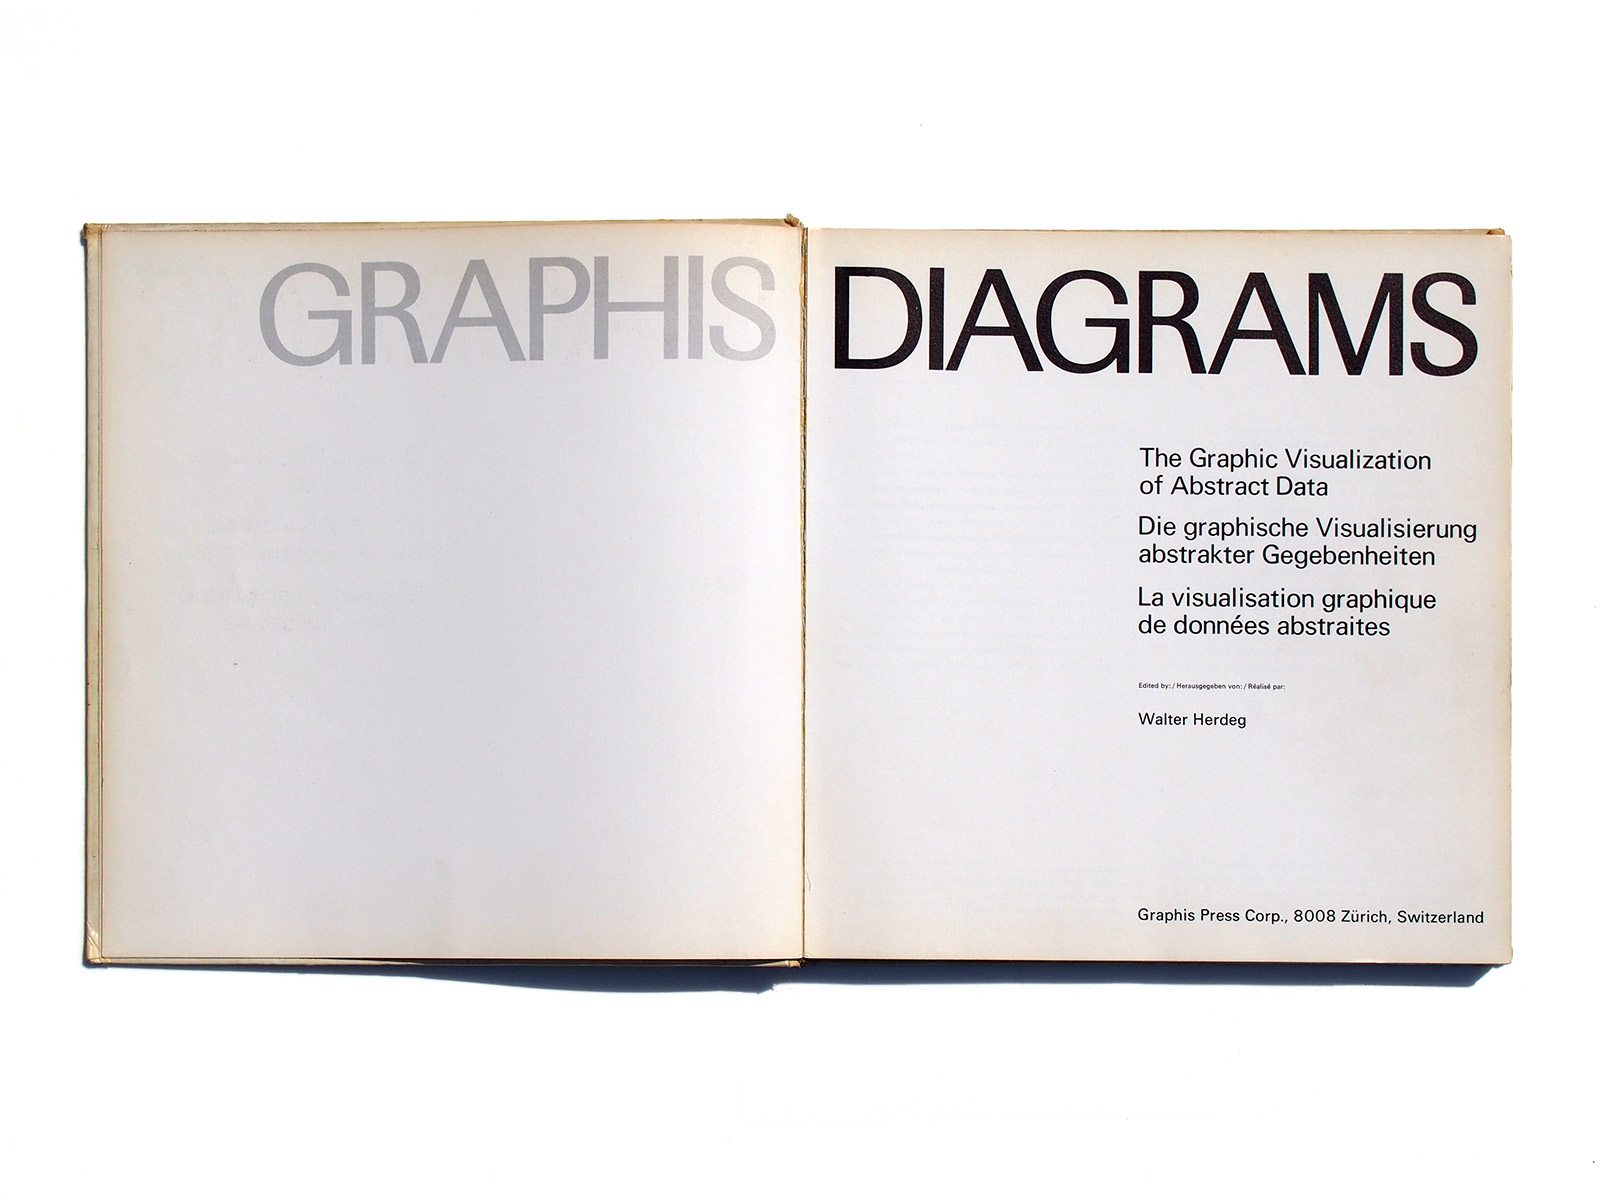
Author: Walter Herdeg


cover design by
Dietmar R. Winkler
The book is trilingual, with texts in English, German, and French.
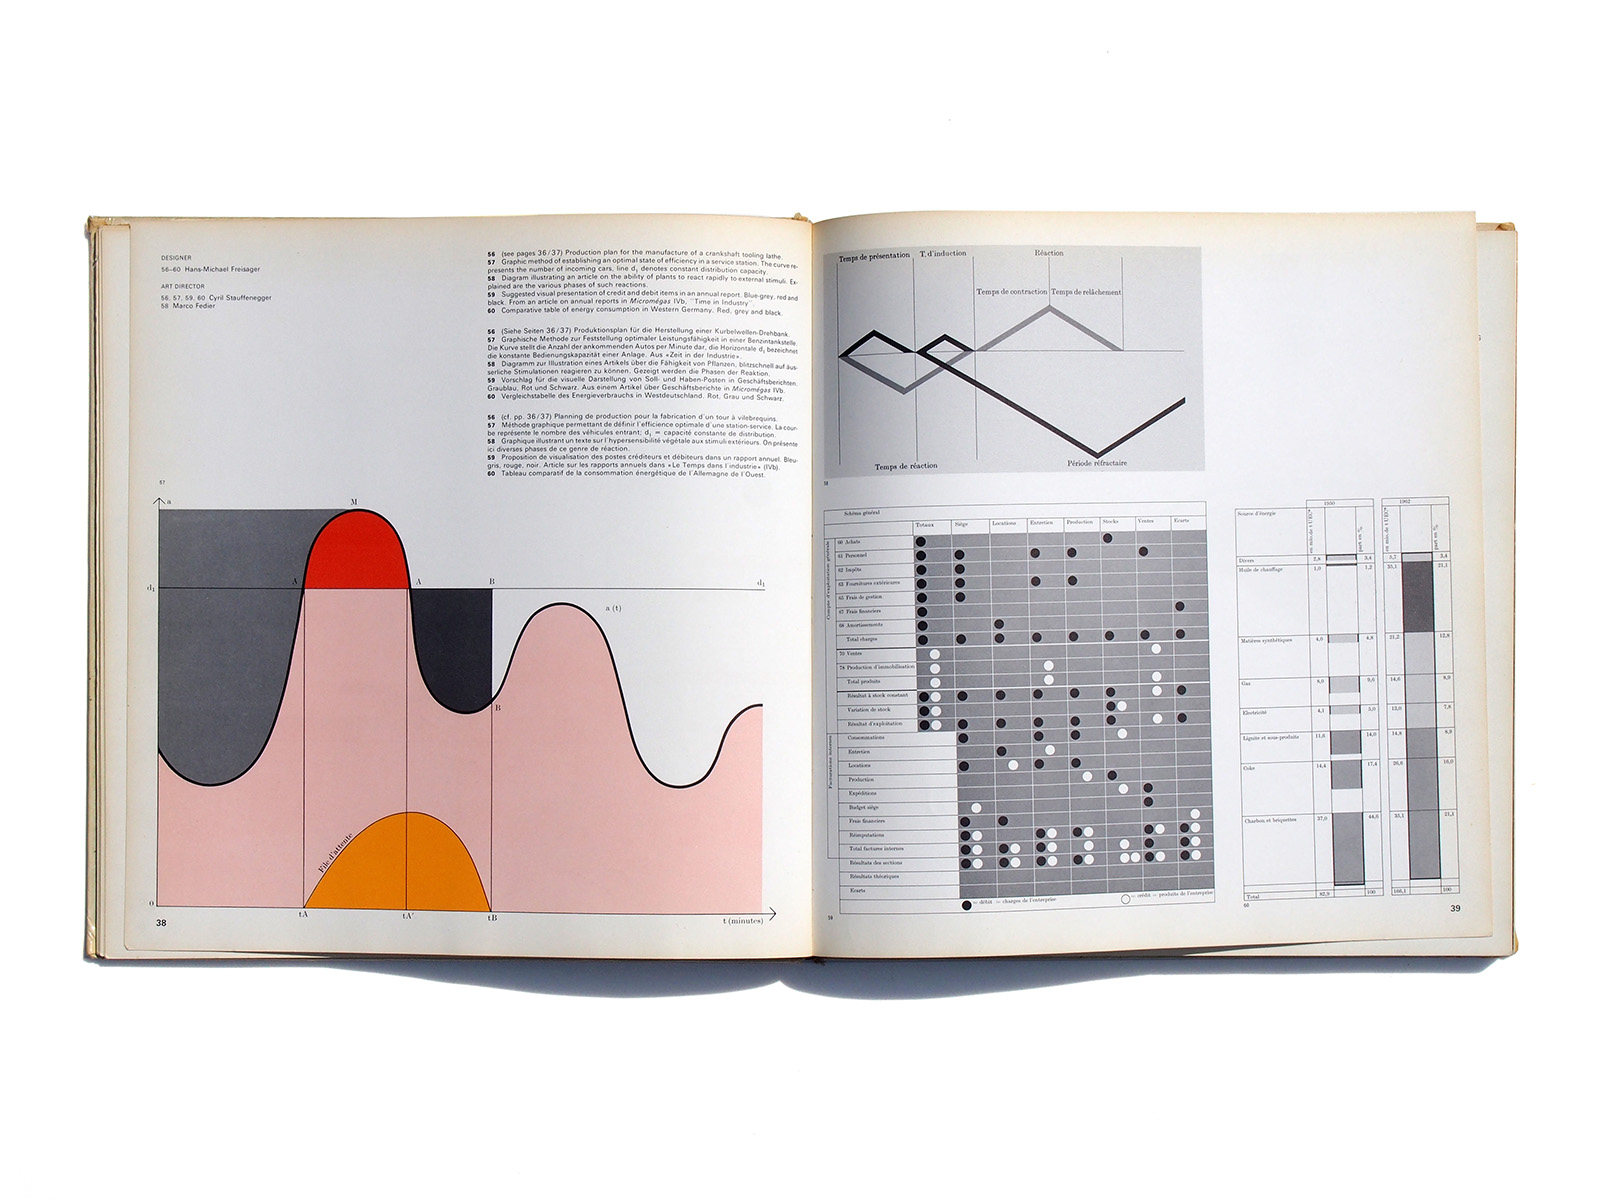
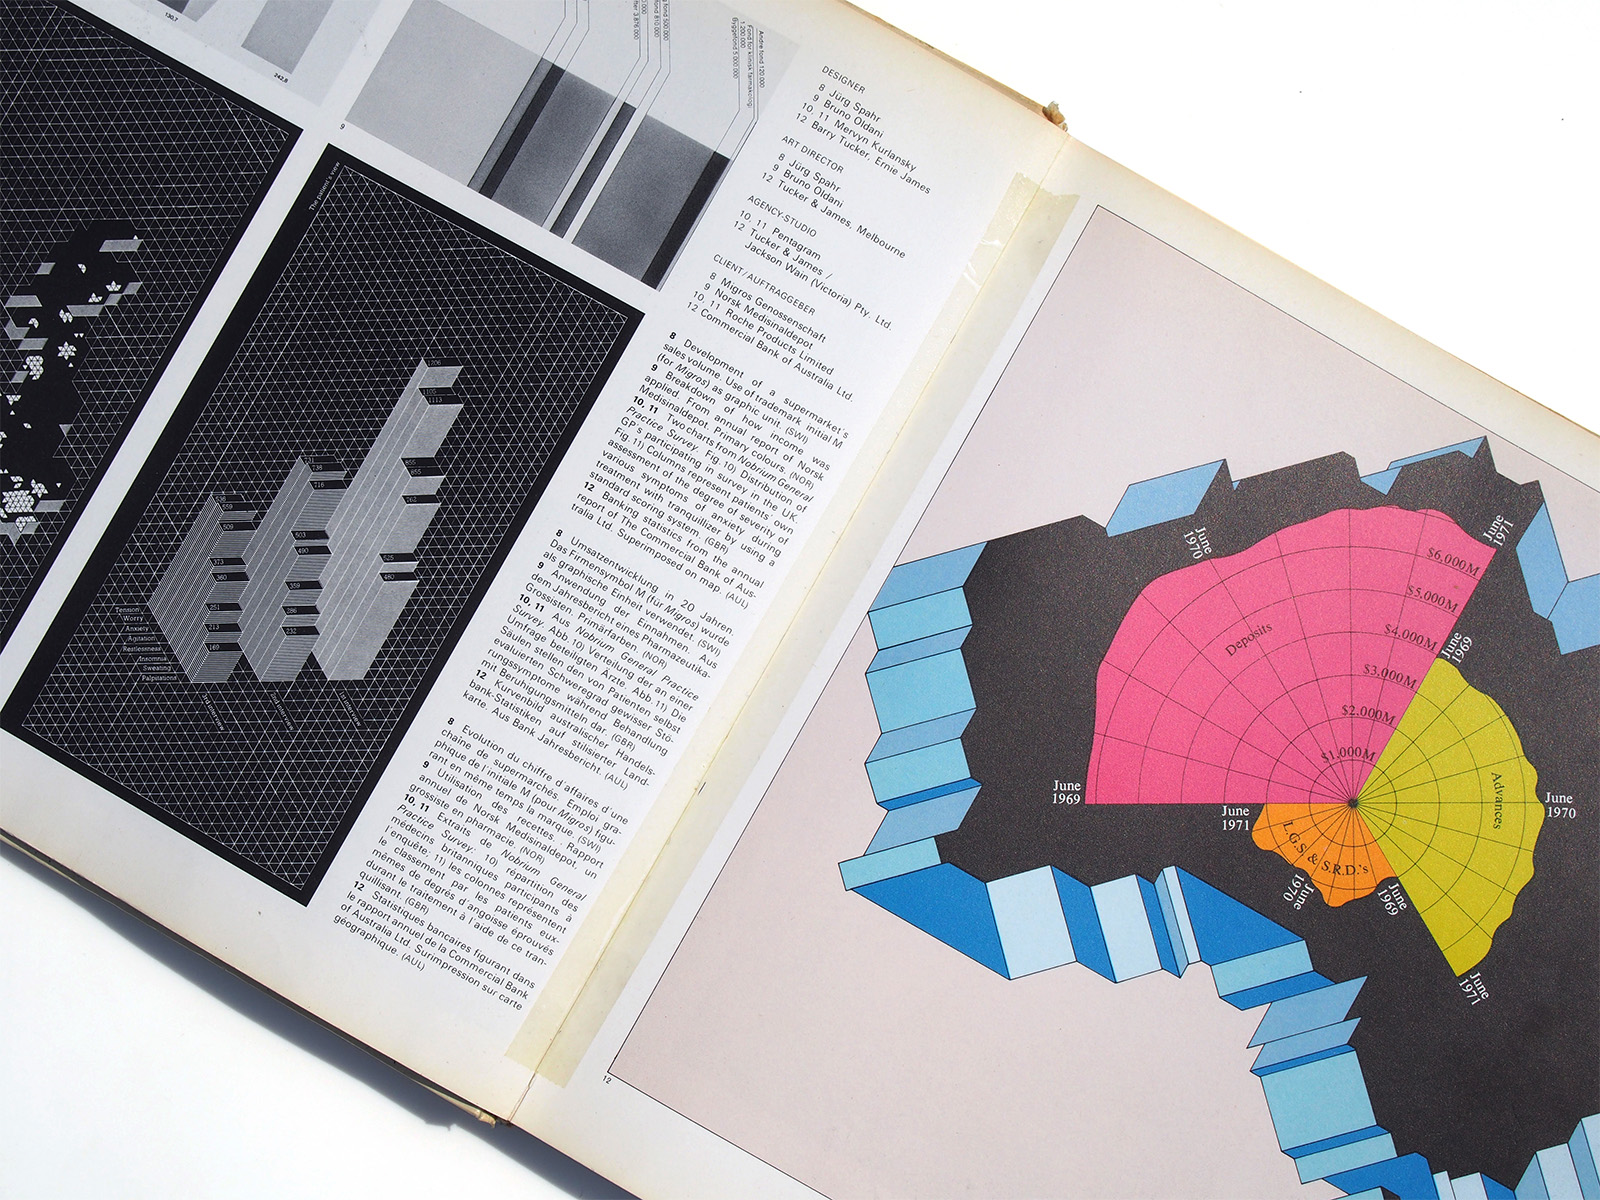
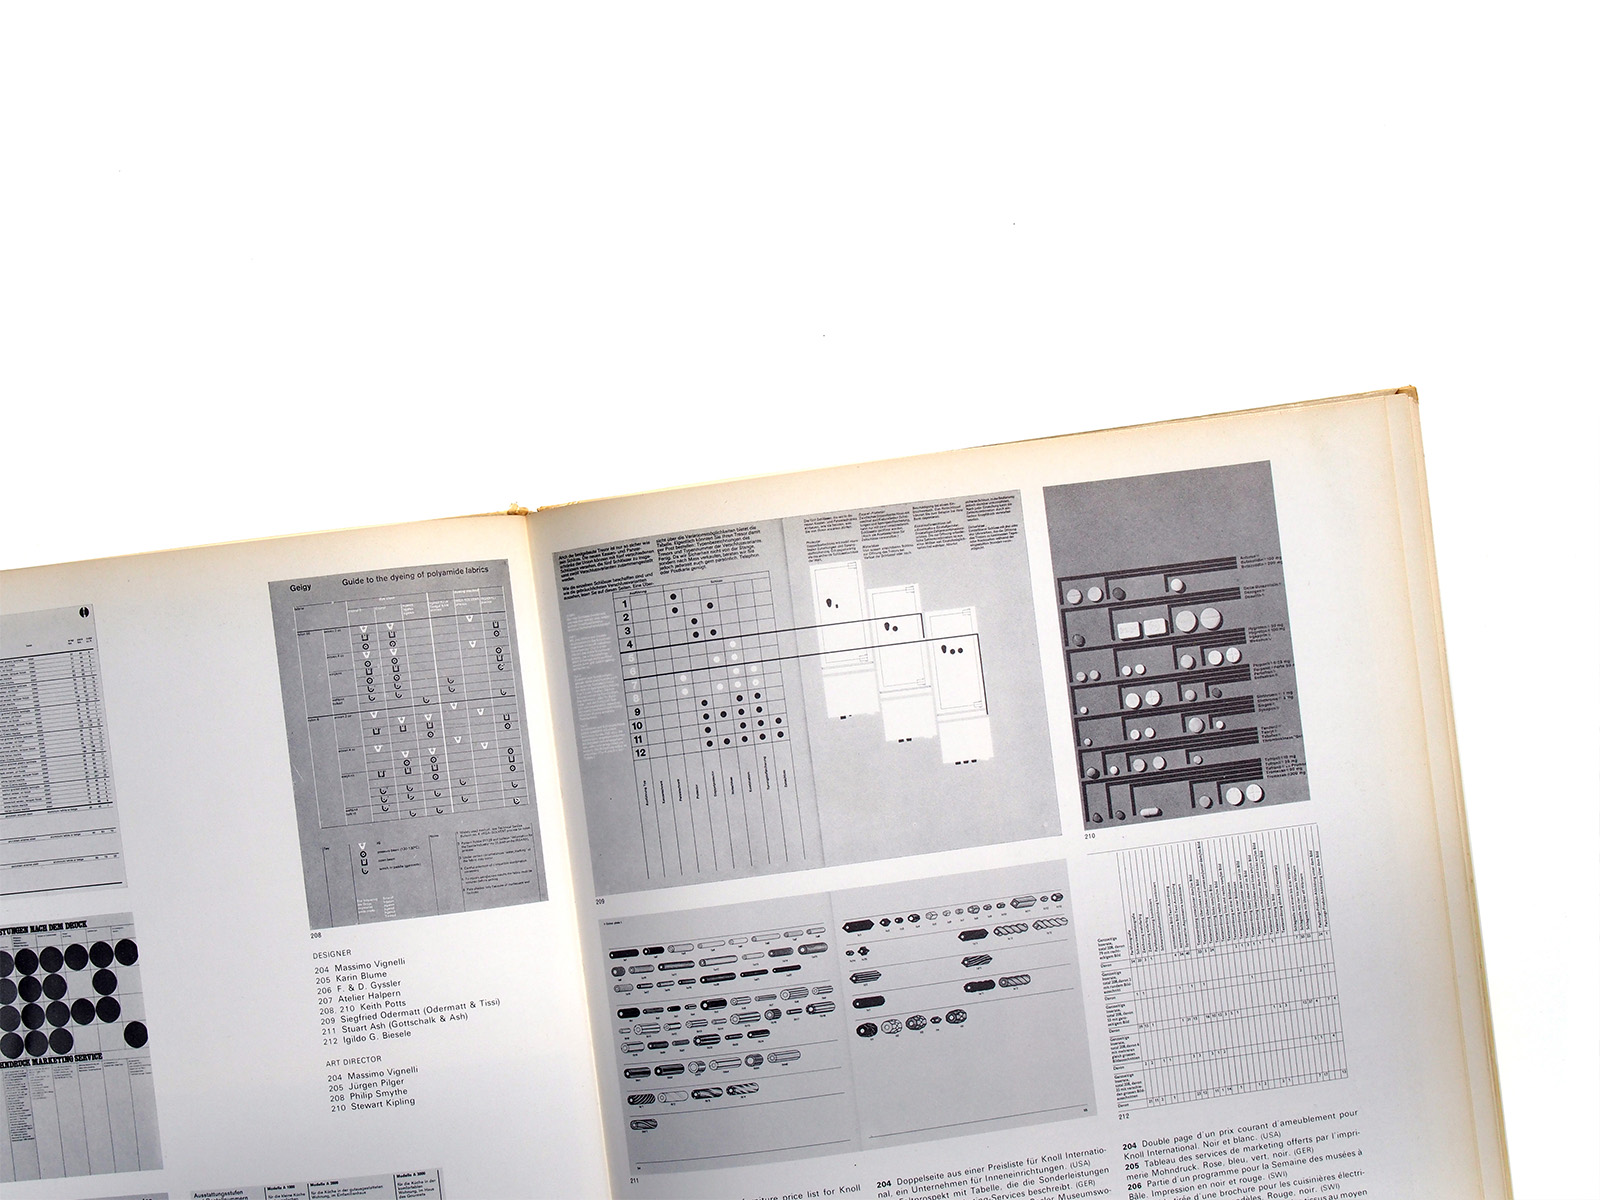
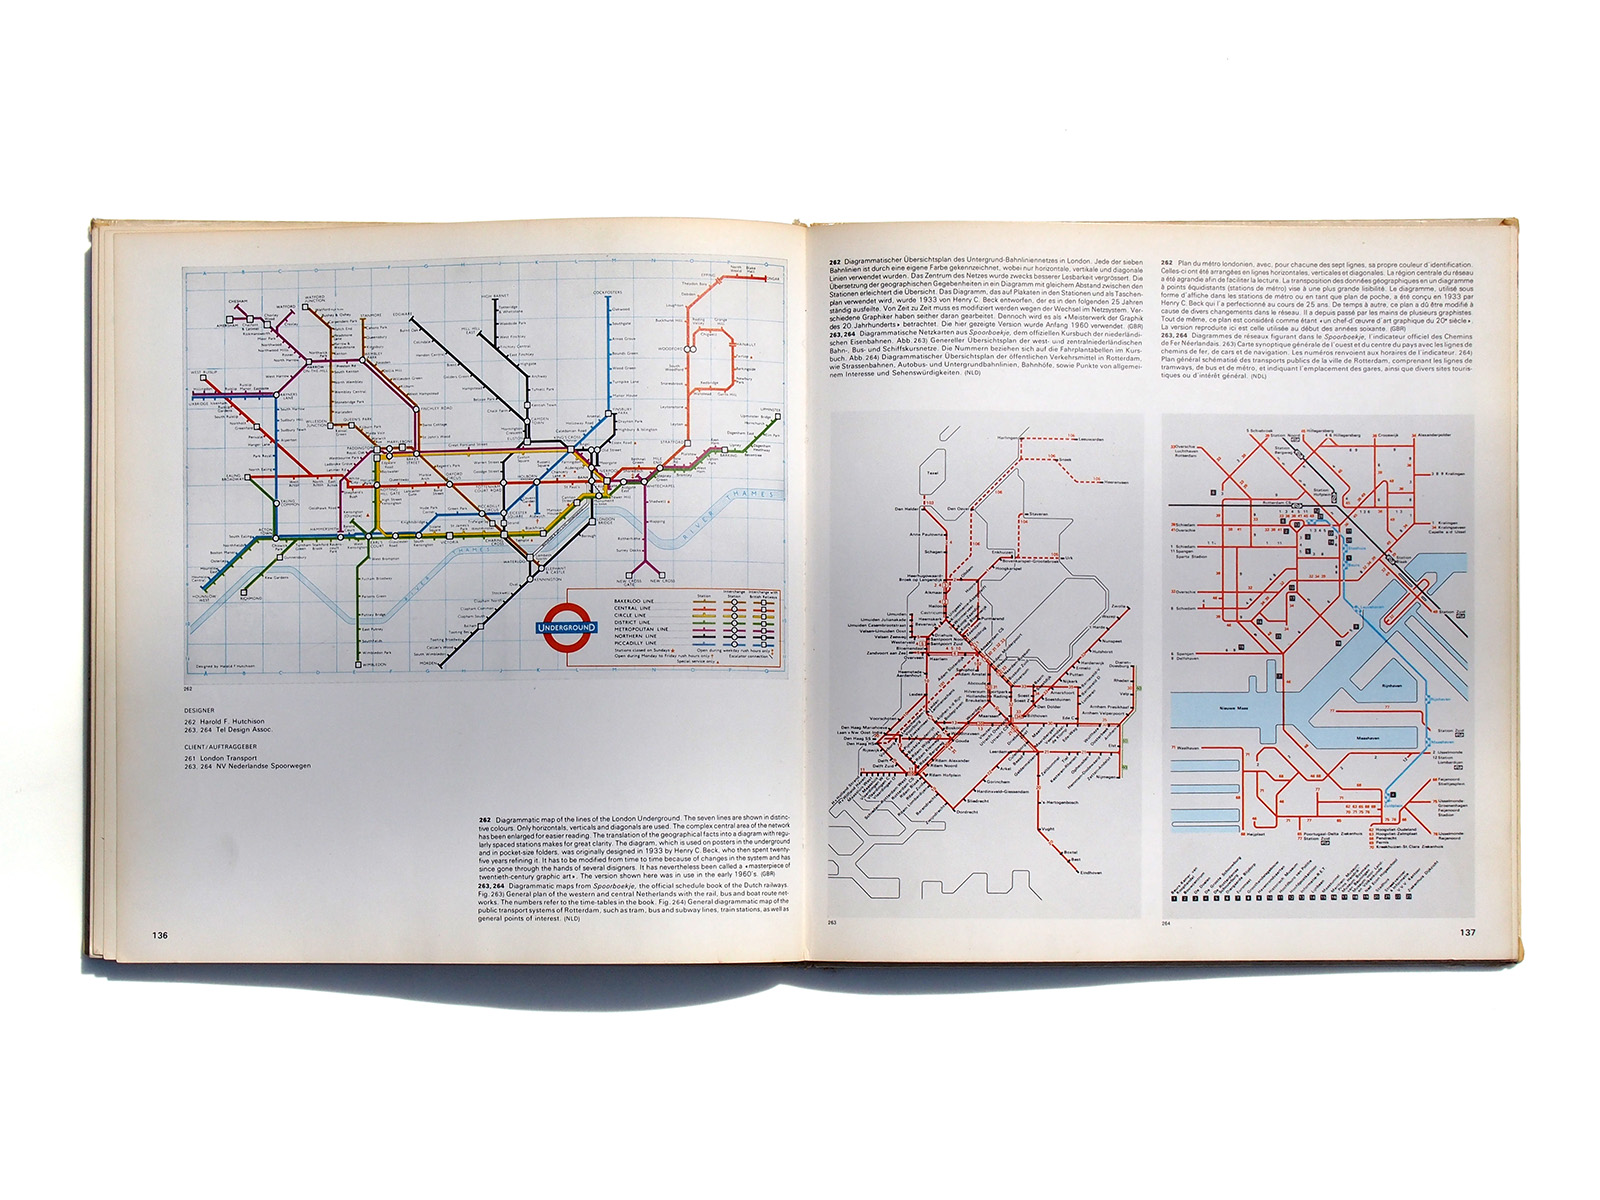
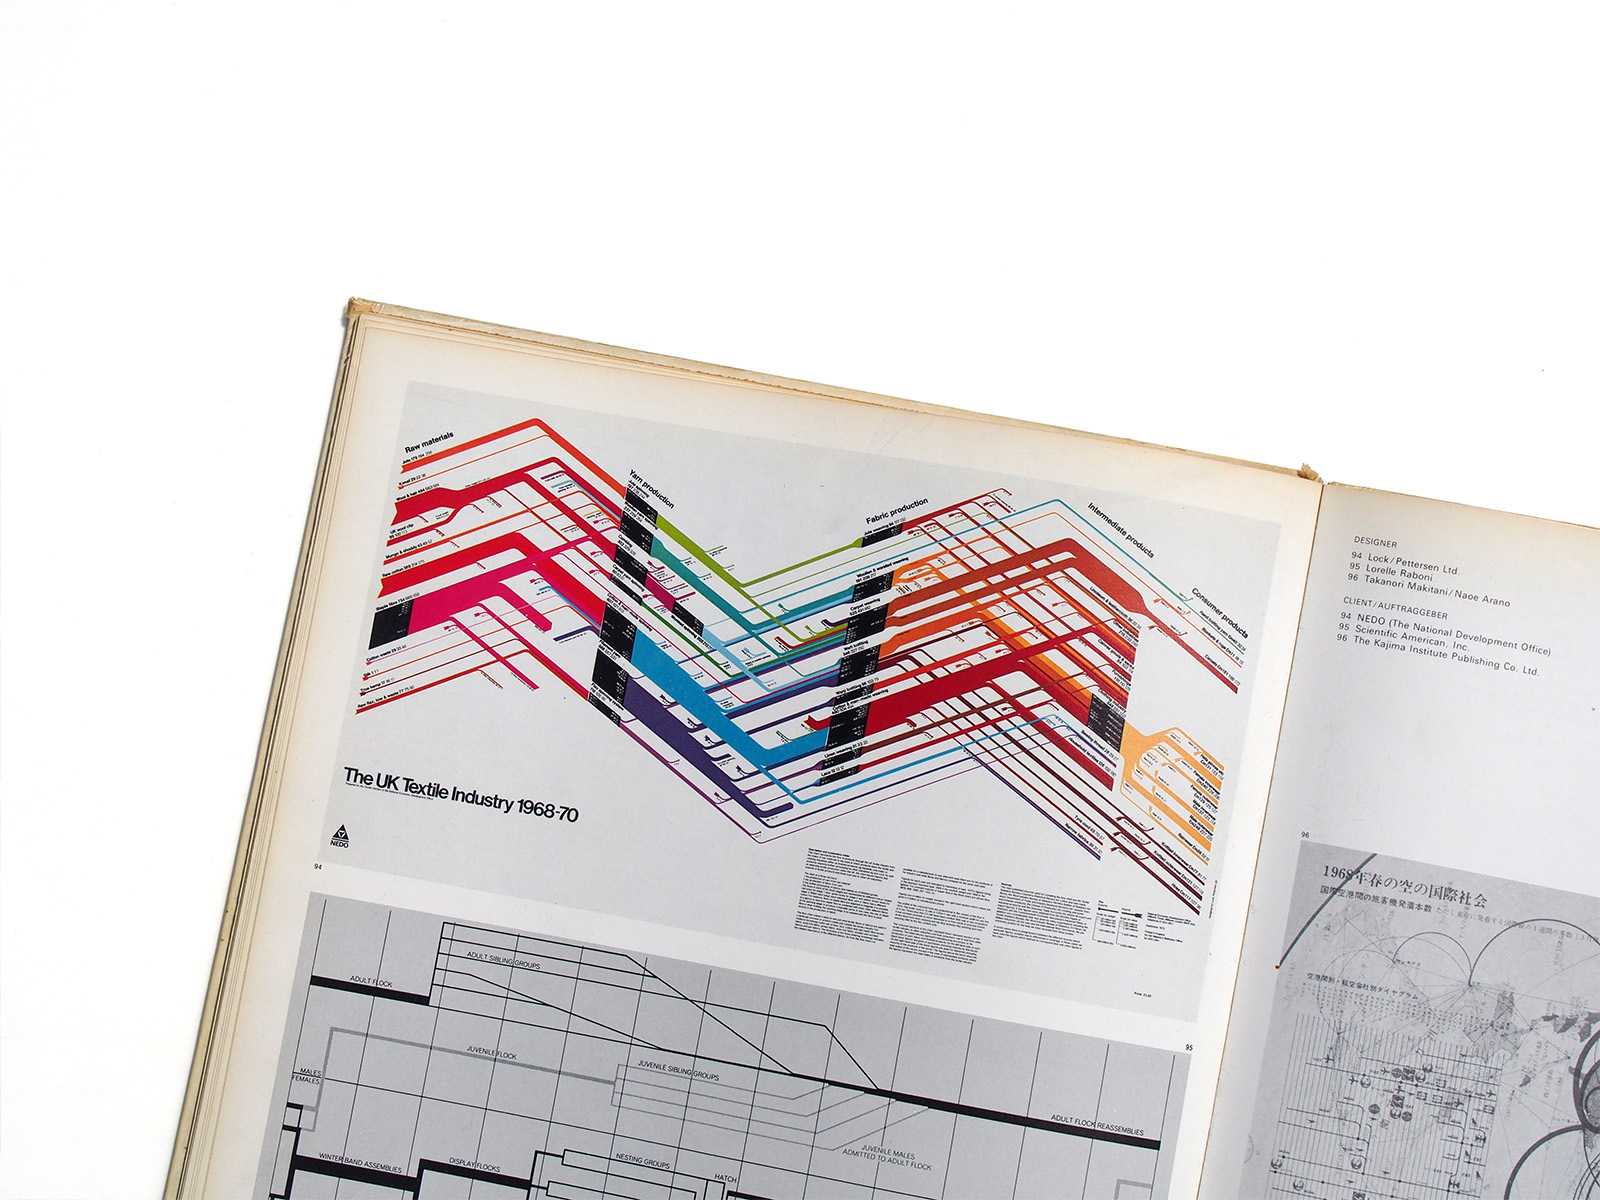
It features a foreword by H. Walter Erdeg and another by Leslie A. Segal, and presents 354 black-and-white and color examples of statistical charts and diagrams, richly illustrating the use of information graphics.
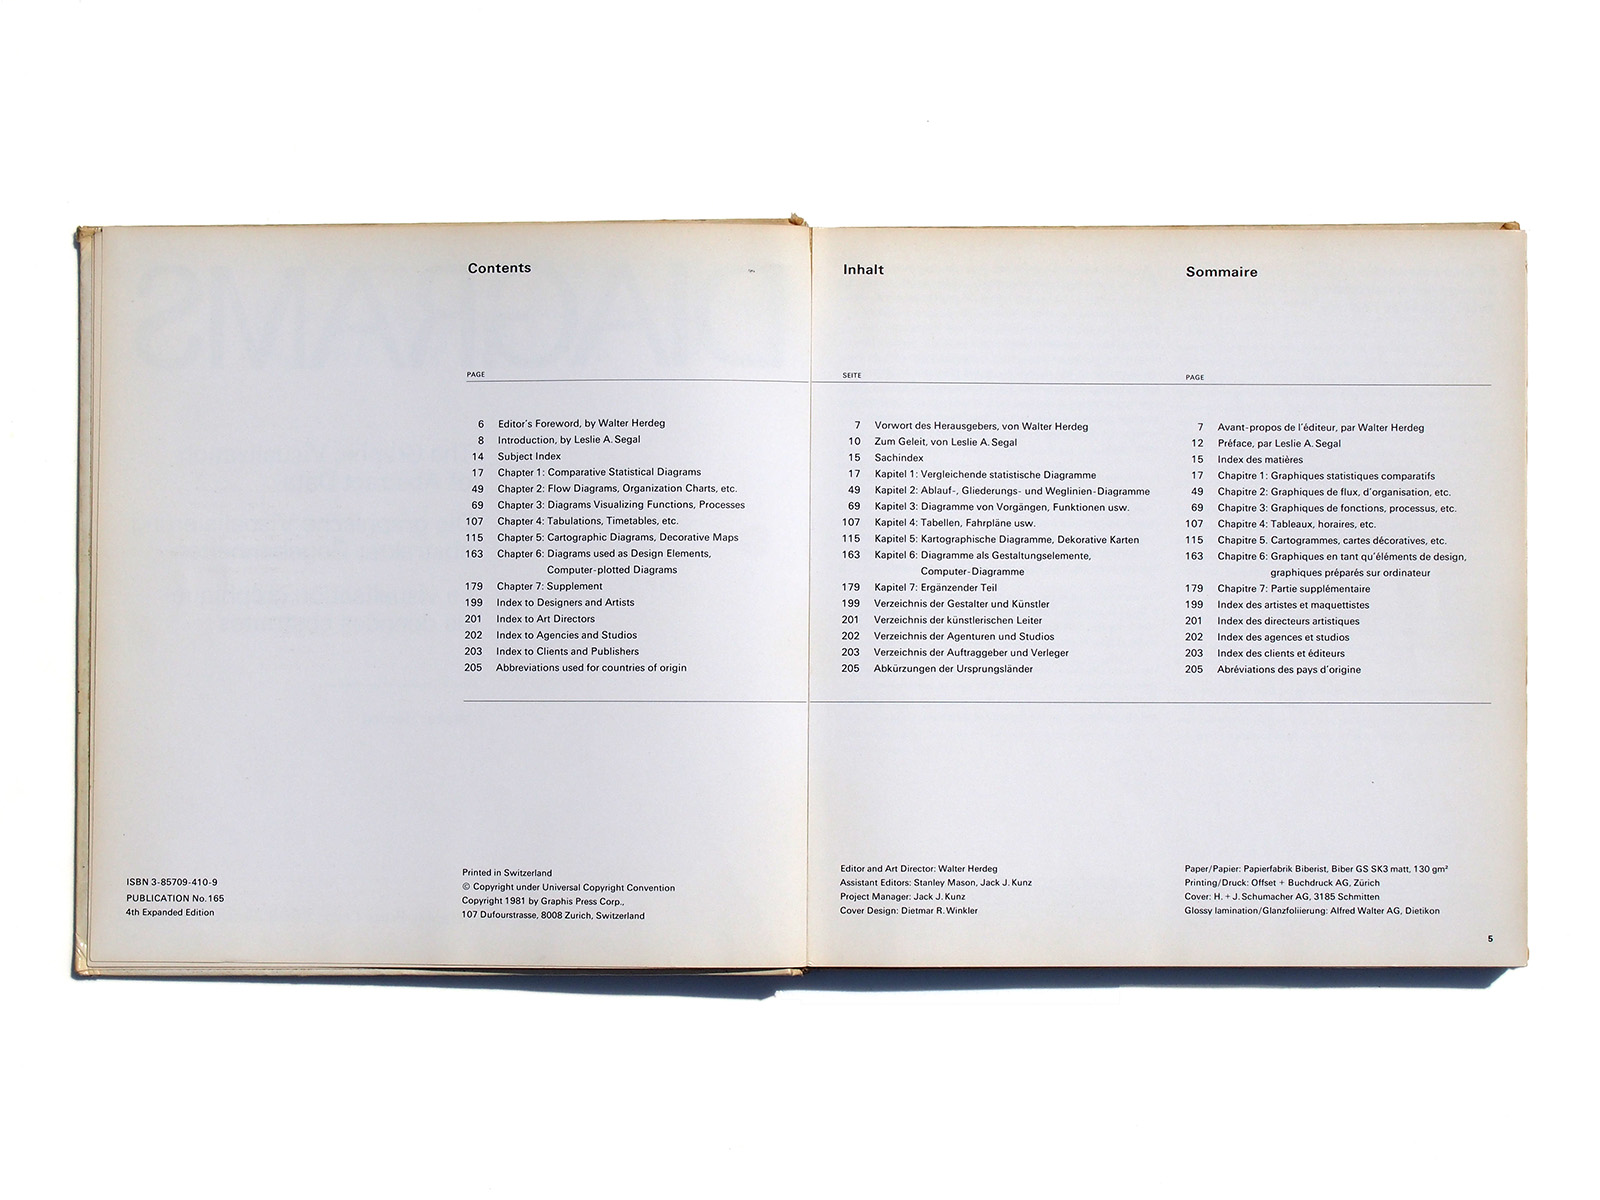
The content is organized into six chapters:
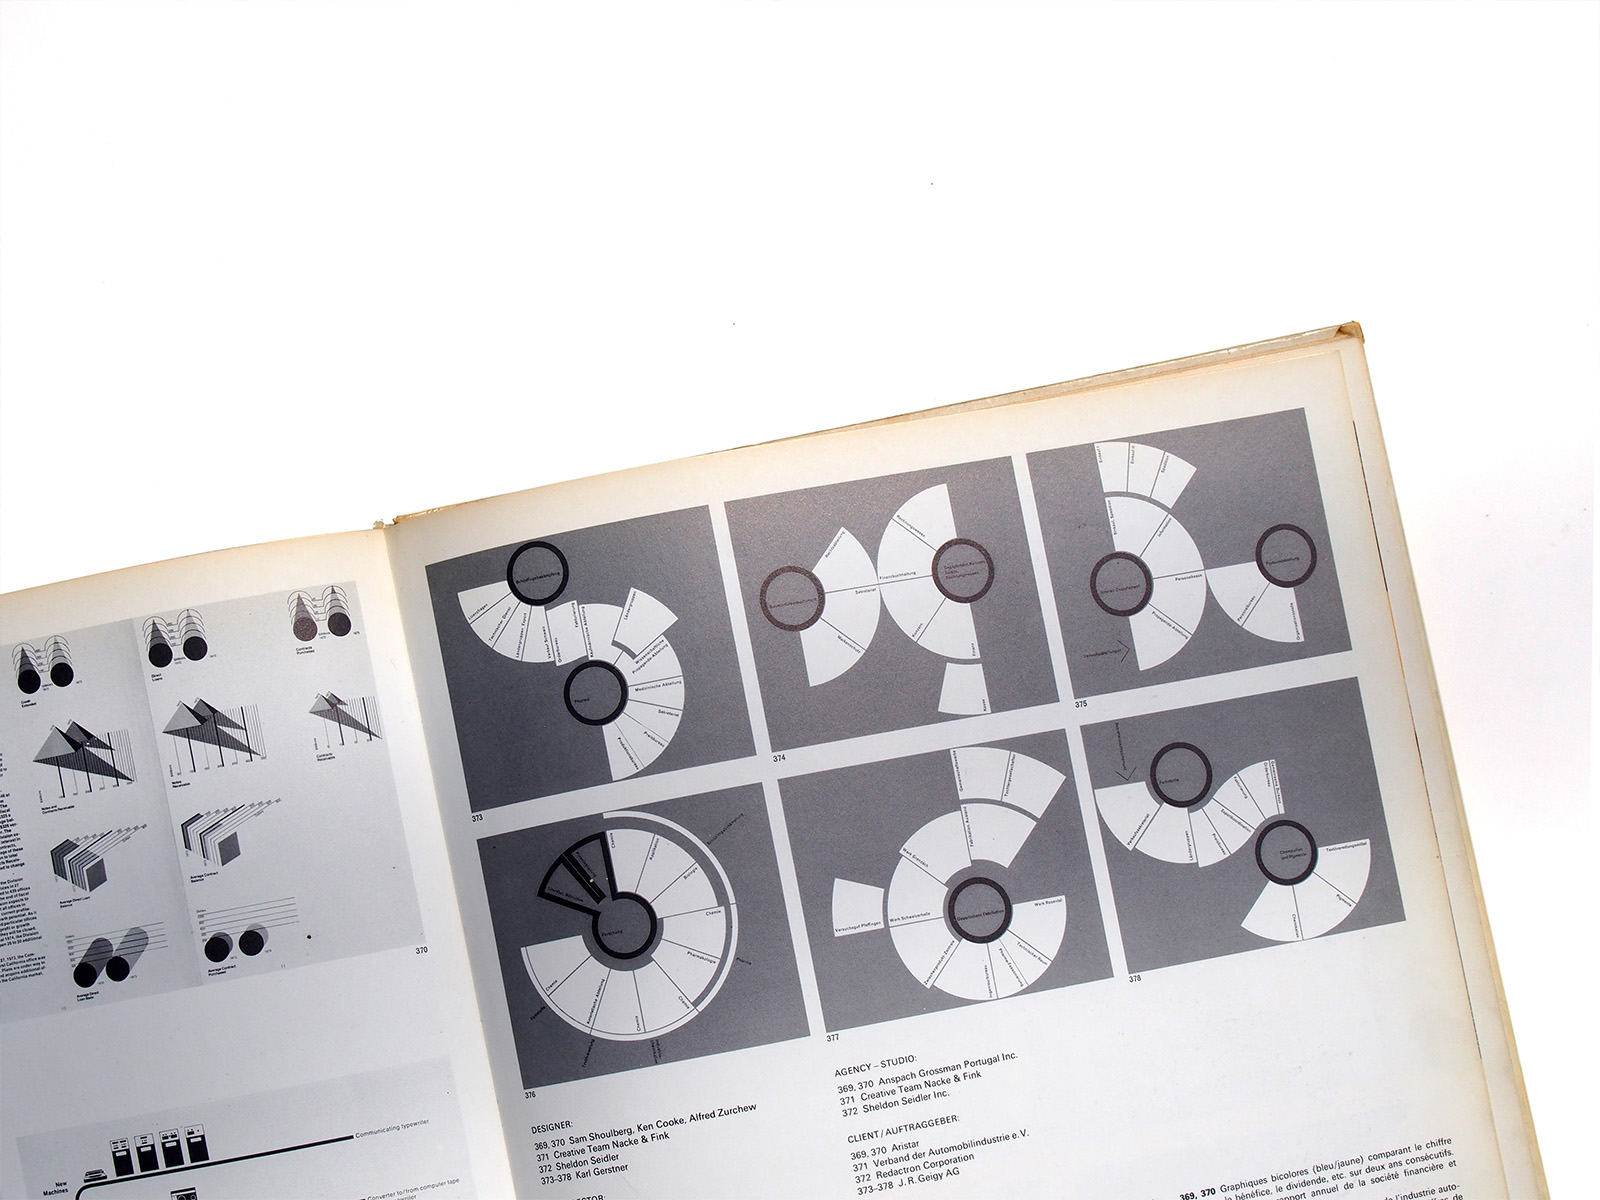
Chapter 1: Comparative Statistical Diagrams
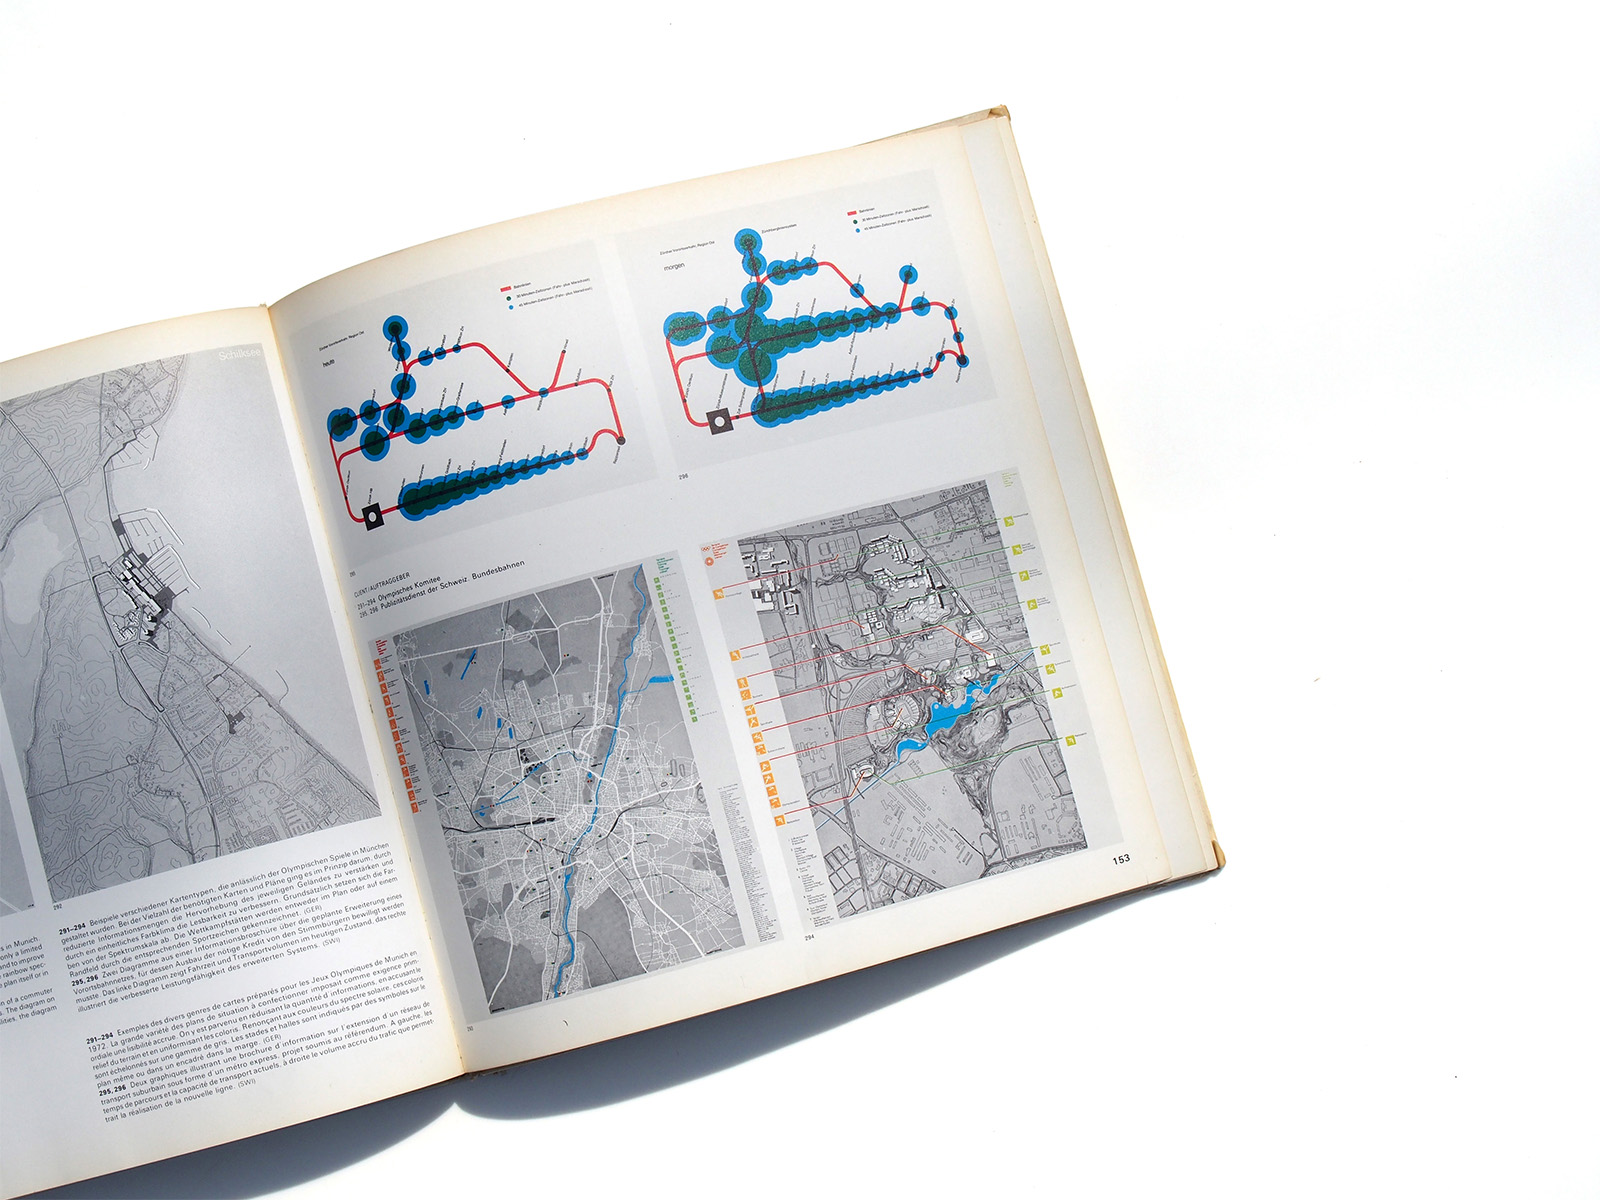
Chapter 2: Flow Diagrams, Organization Charts, etc.
Chapter 3: Diagrams Visualizing Functions and Processes
Chapter 4: Tabulations, Timetables, etc.
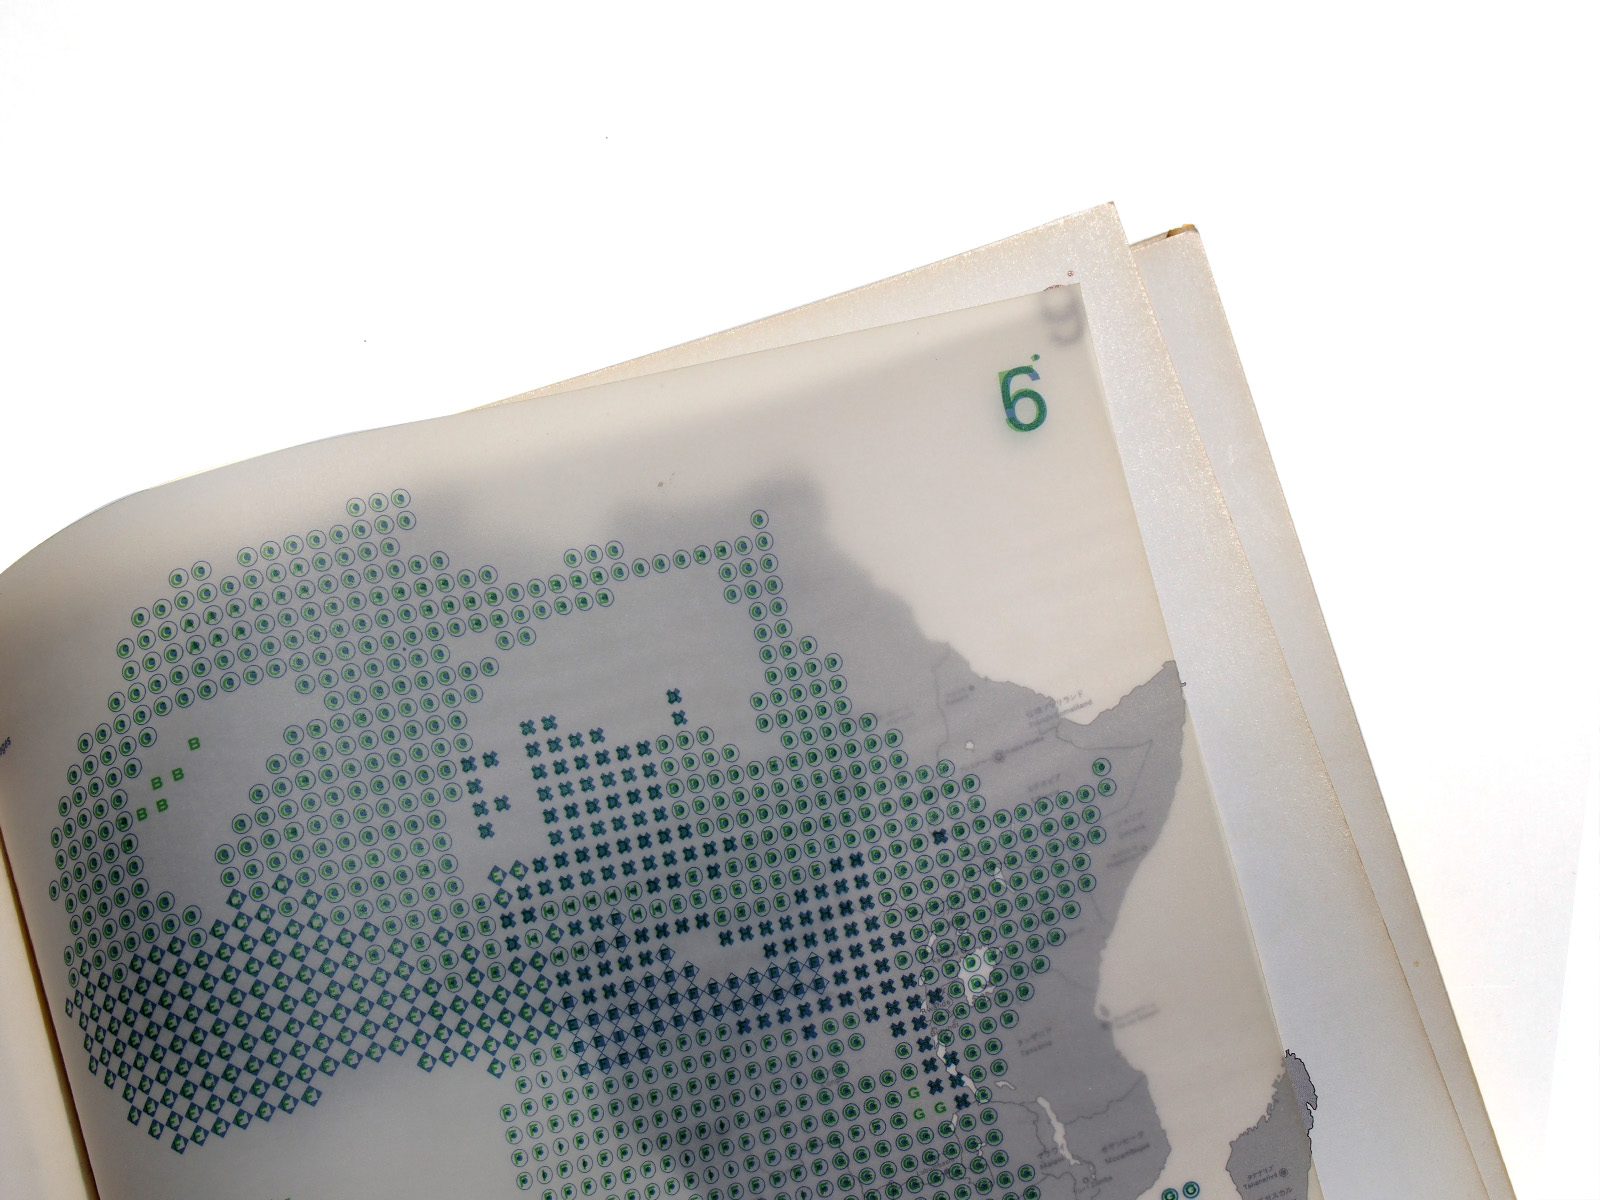
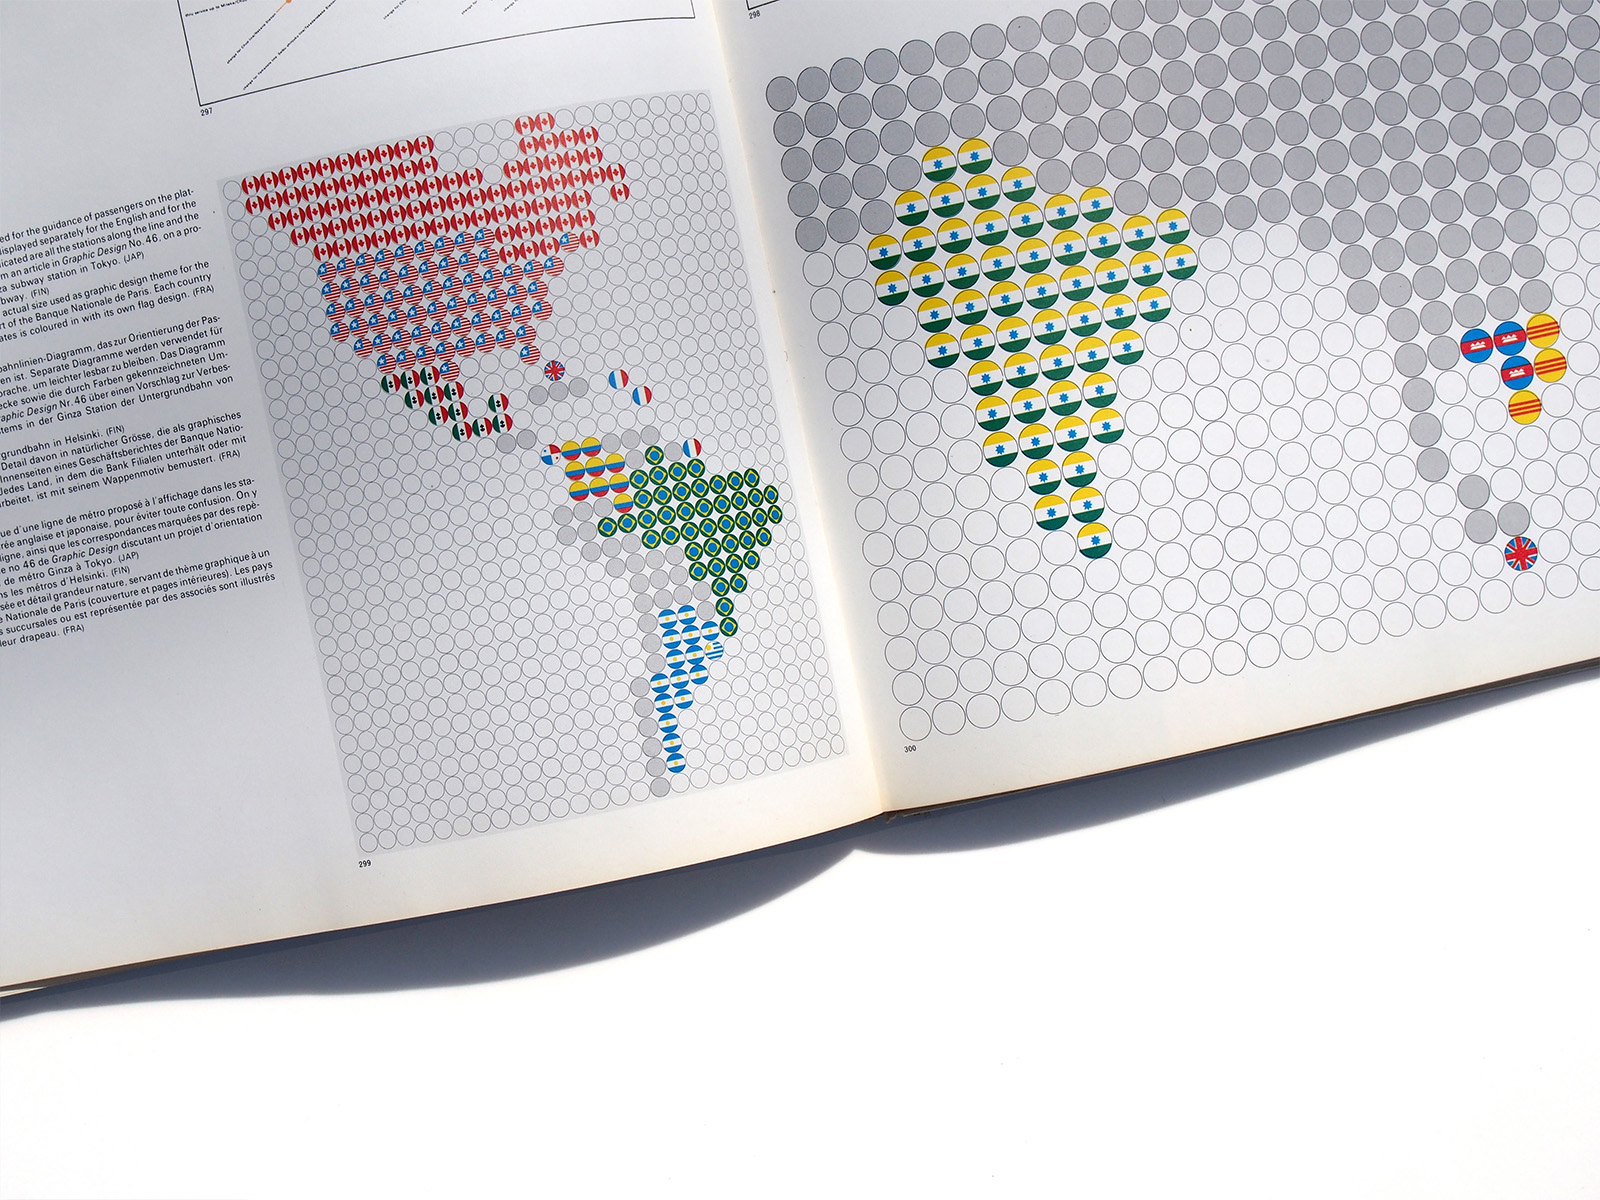
Chapter 5: Cartographic Diagrams, Decorative Maps
Chapter 6: Diagrams used as Design Elements, Computer-Plotted Diagrams